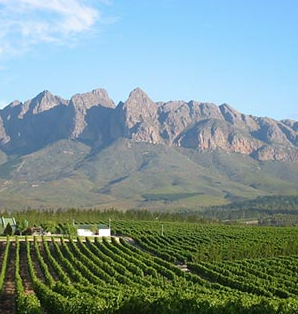
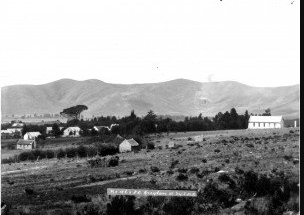
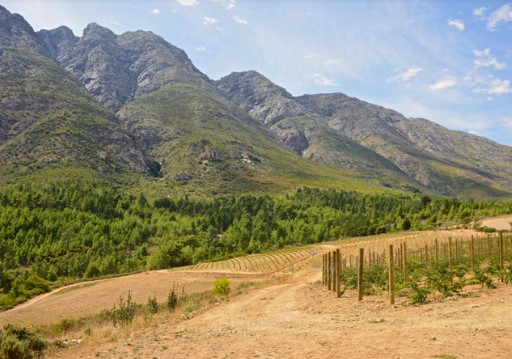
The Division of Robertson was originally part of the district of Tulbagh, whose drostdy was transferred to Worcester in July 1822. It was proclaimed a separate division in about 1858. The region is well-watered with good, fertile soil, and during the colonial era its economy was largely based on viticulture. In some areas sheep herding and fruit growing supplemented this.
The following census figures are available for the division:
1865 census: 6,155 residents, of whom 2,343 were literate
1875 census: 8,031 residents, of whom 2,096 were literate
1891 census: 11,348 residents, of whom 4,606 were literate
1904 census: 15,297 residents, of whom 6,972 were literate
By Franco Frescura
Cape Winelands District remains the largest District outside of the metro in the Western Cape, as it is home to 13.5 per cent of the total population, followed by Eden at 9.9 per cent of the total population in 2011. No significant shifts were evident in the population distribution across the Districts between the two last Censuses. Both 2001 and 2011 Census highlight Drakenstein as the most populous Municipality within the Cape Winelands region. The population of Drakenstein grew from 194 413 in 2001 to 251 262 in 2011. According to the 2011 Census results, the next most populous Municipalities are Breede Valley at 166 825 and Stellenbosch at 155 733 people, whereas the least populated Municipalities within the region is Witzenberg at 115 946 and Langeberg at 97 724. In 2011, the Cape Winelands Regional population composition was as follows: 203 475(25.8%) children, 543 601 (69%) Economically Active and 40 417 persons (5.1%) aged 65 years and older. The 289 623 Youth accounts for 36.8 per cent of the population in 2011 and together with the children represent 493 098 people or 62.6 per cent of the Cape Winelands Regional Population. Children and the Economically active Population grew at an average annual rate of 0.9 per cent respectively between 2001 and 2011 compared to 10.3 per cent growth for the persons aged 65 years and Older. Accordingly, the Child Dependency Ratio decreased from 43.1 per cent in 2001 to 37.4 in 2011 whilst the Age Dependency Ratio increased from 6.9 per cent to 7.4 per The Census of 2011 highlighted that the Coloured racial group remained the largest population group at 62.7 per cent of the total Population in 2011. The African and White population groups retained their positions as the 2nd and 3rd largest Population groups as Africans and Whites accounted for 23.9 per cent and 13 per cent, respectively of the total Population in 2011. The Indian/Asian Population Group account for less than 1 per cent of the total
Population in 2001 and 2011. Education and Training improves access to Employment Opportunities and helps to sustain and accelerate overall Development. It expands the range of options from which a person may choose to create opportunities for a fulfilling life. The level of Education of the Population in a Region influences amongst others its Welfare through indirect Positive Effects on Health and Life Expectancy. Selected indicators affecting the Education and Skill Levels in Communities discussed here are the learner enrolment and learner teacher ratio, Literacy Rate and access to Training Facilities, Education outcomes and learner drop-out rates in the Municipal Area. An indication of the number of no fee Schools in a Municipal Area gives a sense of the extent to which the Department of Education has identified and prioritised support to Households who are unable to make a contribution towards the costs of Education.
Literacy is used as a concept to indicate a Minimum Education Level attained; a simple definition of Literacy is the ability to read and write, which has been translated into the successful completion of a minimum of 7 years of Formal Education. Since most Learners start school at the age of 7 years, the Literacy Rate is calculated as the proportion of those 14 years and older who have successfully completed a minimum of 7 years of Formal Education. Learners in a Farming Area for example may be encouraged through various support initiatives such as Learnerships, Apprenticeships and Bursaries to consider Agriculture Studies, often offered at FET colleges, the Department of Agriculture (through various Diploma Courses) and Tertiary Studies at Universities. These are often done as effort to retain skills in the Region or to Develop the Potential of the People in this Area. One Area where challenges exist would be to ensure that sufficient Technical Curricula exists, particularly those of Engineers, Agricultural Extension Officers and various categories of Artisan Training are available within the Municipal Area.
The Learner Teacher ratio is very important, because it is closely related to the amount of money spent per child. It also has an impact on the Education outcomes.
Overall, the level of Eeducational Attainment in Cape Winelands District has improved from 2001 to 2011. The number of Individuals without any Schooling decreased from 32 150 in 2001 to 29 364 in 2011. The number of Individuals that completed Primary School increased from 35 278 to 50 730 between 2001 and 2011. The number of individuals that achieved Grade 12 increased from 73 441 to 128 634 while the number of individuals that achieved Higher Education increased from 35 696 to 53 307 between 2001 and 2011.